IR Analysis of HHP Molecule
The IR spectrum of the HHP molecule (also known as IIF) - C₁₇H₂₀O₂, 39 atoms, 111 normal modes - was computed at the DFT/def2-TZVP level with dispersion correction, applying the Merrick-Moran-Radom scaling factor (0.9614) to frequencies for thermodynamic properties calculation at 298.15 K and 1.0 atm.
Spectral Regions
X–H Stretching (2500–4000 cm⁻¹)
The band at 3650 cm⁻¹ (68 km/mol) is characteristic of a free hydroxyl ν(O–H), consistent with a non-hydrogen-bonded phenolic or enolic group. The dense C–H stretching band between 2862 and 2970 cm⁻¹ indicates multiple aliphatic CH₂ and CH₃ groups, while bands at 3018–3050 cm⁻¹ belong to aromatic/olefinic C–H bonds.
Double Bond Region (1500–2500 cm⁻¹)
The most intense peak of the entire spectrum falls at 1666 cm⁻¹ (196.6 km/mol), unambiguously assignable to ν(C=O) of a conjugated carbonyl (enone or α,β-unsaturated system). The band at 1564 cm⁻¹ (134 km/mol) and that at 1554 cm⁻¹ (85 km/mol) suggest C=C stretching in an aromatic/conjugated system. The 1700–2800 cm⁻¹ window is practically transparent, typical of a compound lacking alkyne or cumulated groups.
Fingerprint Region (600–1500 cm⁻¹)
This region is the densest. The strongest peaks are at 1191 cm⁻¹ (113 km/mol), 1225/1234 cm⁻¹ (~76–77 km/mol), and 1279 cm⁻¹ (54 km/mol), assignable to ν(C–O–C) or ν(C–O) stretchings of the remaining oxygen atom, and at 1095 cm⁻¹ (55 km/mol). Signals around 1057 and 1128 cm⁻¹ complete the ether/phenolic signature. Bands between 802 and 950 cm⁻¹ correspond to aromatic out-of-plane γ(C–H) deformations.
Skeletal Region (<600 cm⁻¹)
Dominated by ring deformations and torsions. The most intense peak in this area falls at 373 cm⁻¹ (48 km/mol), likely a deformation mode of the polycyclic core.
Chart
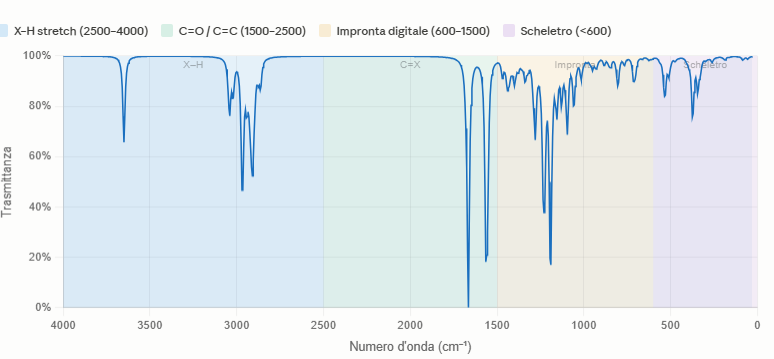
Figure 1: Calculated transmittance spectrum for HHP
Dynamic Synthesis
Rigidity of the Polycyclic Skeleton
The polycyclic carbon skeleton of HHP shows a vibrational structure consistent with a rigid system. The ν(C=O) mode at 1666 cm⁻¹ is the most intense peak and reflects a high force constant incompatible with significant deformations at room temperature. The aromatic/conjugated ν(C=C) modes at 1554 and 1564 cm⁻¹ (85–134 km/mol) and the out-of-plane γ(C–H) deformations between 802 and 882 cm⁻¹ show kT/ν ratios between 0.12 and 0.26, indicating that at 298 K these modes are thermally underpopulated. The skeleton is essentially immobile on any time scale relevant for molecular recognition.
Lability of C15 and C16 Gem-Dimethyl Methyls
The methyl groups C15 and C16, both bonded to the quaternary carbon C1, exhibit a vibrational profile clearly distinct from the rest of the molecule. Three lines of evidence support their lability:
- Low-frequency torsions: Modes 6–9 (44–85 cm⁻¹), attributable to the torsions of the gem-dimethyl methyls, exhibit kT/ν ratios between 2.4 and 4.6 at 298 K. This means that the available thermal energy exceeds the vibrational barrier by more than twofold: the methyls behave essentially as quasi-free rotors at physiological temperature, continuously exploring the entire dihedral conformational space
- Gem-dimethyl splitting: Modes 86 and 87 (1429 and 1436 cm⁻¹, intensities 11.82 and 4.32 km/mol) correspond to the antisymmetric and symmetric combinations of the mechanically coupled umbrella deformations of C15 and C16. The splitting of ~7 cm⁻¹ and the intensity ratio of about 3:1 are the direct spectroscopic signature of the coupling between the two gem methyls and confirm their structural and dynamic identity.
- Symmetric umbrella band: Mode 81 (1377 cm⁻¹, 7.43 km/mol) shows a δ_s(CH₃) deformation frequency unperturbed by interactions with the skeleton, consistent with methyls that do not participate in any rigid collective mode of the molecule.